8 Hours with AI and College Football Bias
Timothy Robinson · December 4, 2025
Introduction — A Fan’s Frustration Becomes an Experiment
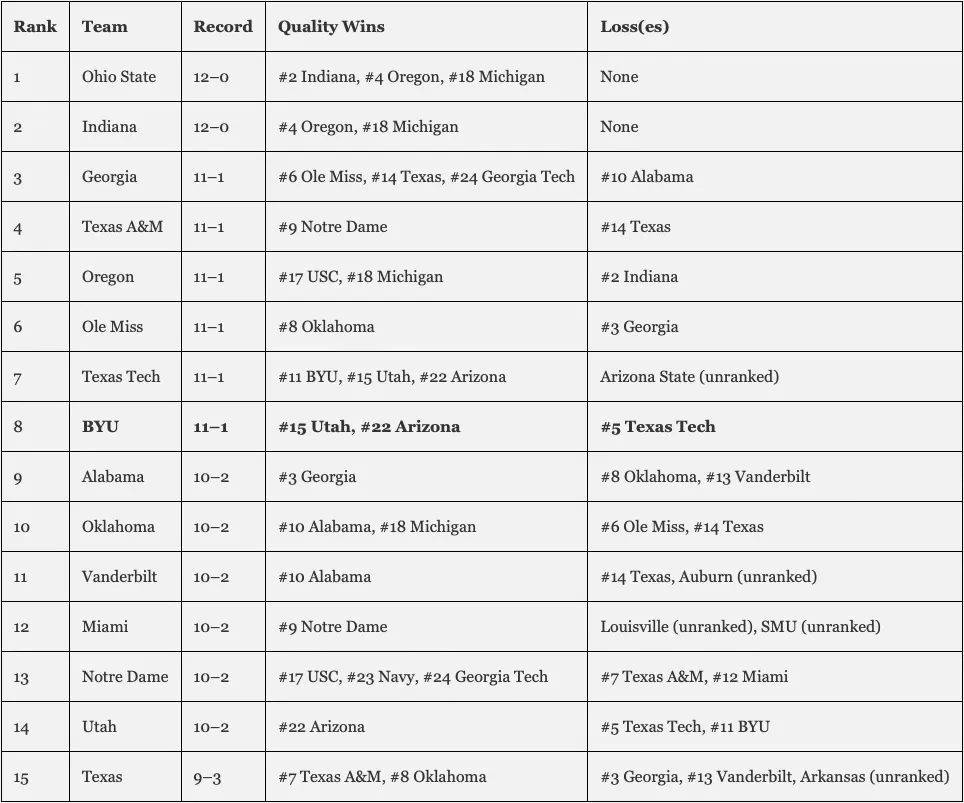
I’m a BYU football fan. I should probably get that out of the way up front, because it explains why I spent eight hours arguing with five different AI systems about college football rankings. When the CFP Committee released their penultimate rankings yesterday and BYU sat frozen at number 11, I was bothered.
Not because I thought BYU was the best team in the country—I’m a fan, but I’m not delusional. What bothered me was the math. BYU had gone 11-1. They’d beaten Utah, ranked 15th in the final AP poll. They’d beaten Arizona, ranked 22nd. Their only loss was to Texas Tech, ranked 5th. And yet the Committee had placed them behind Notre Dame (10-2), behind Miami (10-2), behind Alabama (10-2). Behind teams with worse records who had lost to lower-ranked opponents.
I know how this sounds. Every fan base thinks their team is disrespected. I didn’t want to be that guy. I really wanted to know: Is BYU actually being undervalued, or am I just seeing what I want to see?
So I decided to ask the machines.

Soule’ Photography (2023). Sept 16, 2023:NCAA Football, BYU 38:31. Shutterstock. http://bit.ly/4rEsL6u
The premise was simple. Large language models like ChatGPT and Claude have access to vast amounts of sports data. They don’t have rooting interests. If I could prompt them to analyze teams purely on performance metrics—wins, losses, strength of schedule, head-to-head results—maybe I could get something closer to an objective ranking.
I drafted a careful prompt. I told the AI to rank teams based only on 2025 regular season performance. I explicitly prohibited certain inputs: no pundit opinions, no preseason polls, no conference brand loyalty. Just the data.
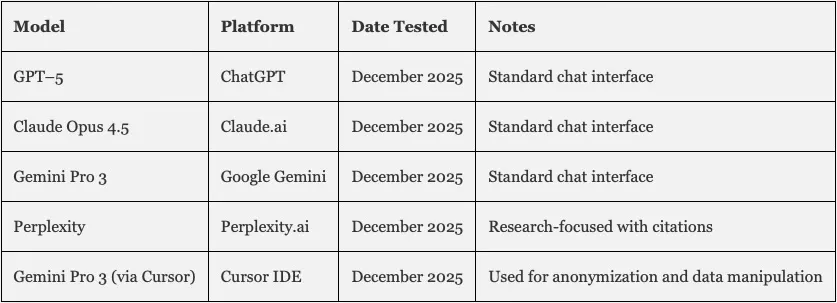
I ran this prompt across five different AI systems: ChatGPT 5, Claude Opus 4.5, Gemini Pro 3, Perplexity, and Cursor (using Gemini Pro 3 as it’s engine). I figured if they all converged on similar rankings, I’d have my answer.
What I got instead was an 8-hour education in the ways that AI systems inherit human biases, hallucinate basic facts, and struggle to distinguish between fundamentally different questions.
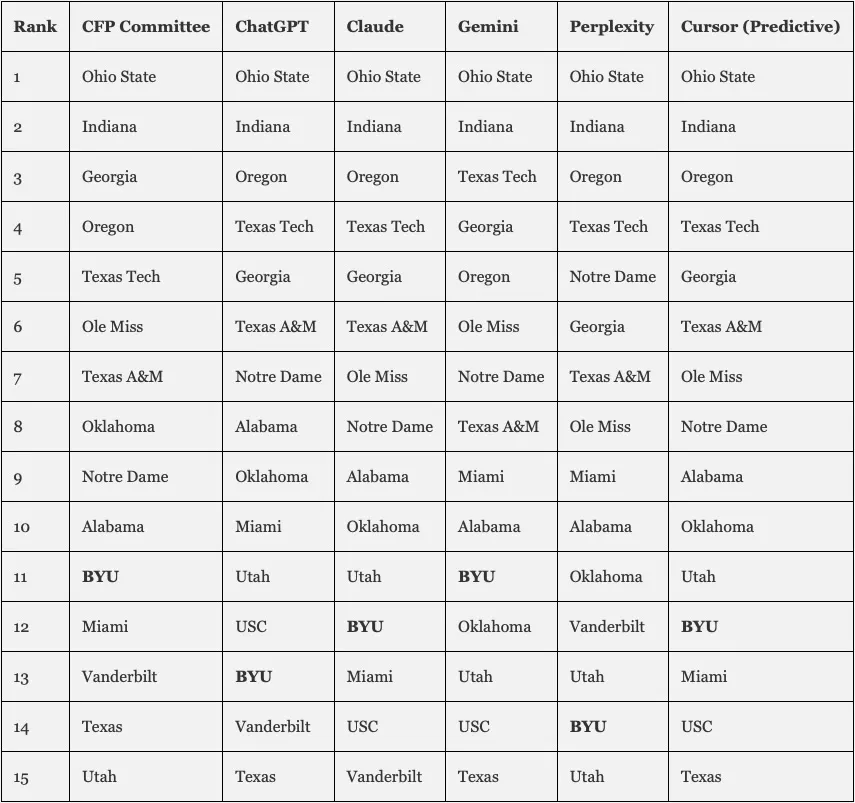
The short version: Every AI ranked BYU somewhere between 11th and 14th. Almost exactly where the CFP Committee had them. Despite my explicit instructions to ignore pundit opinions and conference reputation, the machines produced rankings that looked suspiciously like the ones the humans had already made.
When I dug into why, I found three problems. First, the AIs couldn’t keep their facts straight—one model needed three attempts to correctly identify who BYU had lost to. Second, the AIs were drawing from sources that already contained the biases I was trying to exclude. Third, and most interesting, the AIs were answering a different question than the one I thought I was asking.
I wanted to know which teams had accomplished the most. The AIs kept telling me which teams were most likely to win future games. These sound similar, but they’re not the same question. And the gap between them is where all the controversy lives.
What follows is an account of those eight hours: the prompts I used, the errors I uncovered, the workarounds I attempted, and the insights that emerged when I finally asked the AI to explain why its rankings differed from a purely results-based approach.
I started hoping to find an objective answer to a subjective question. What I found instead was that the question itself was hiding a philosophical dispute that no amount of data could resolve.
II. The Experiment and Its Errors
I started with ChatGPT, the way most people start—because it was there. The prompt took me twenty minutes to draft. I wanted to be precise about what I was asking for and, more importantly, what I was asking the AI to ignore.
The core instruction was straightforward:
“You are a college football analytics savant. Your overall task is to analyze the performance of all the NCAA college football teams this year and rank them according to their actual capabilities on the field based on their performance during the regular season.”
Then came the exclusions:
“Do NOT consider the opinions of experts or commentators at all for your analysis or your ranking. You should also IGNORE any Pre-Season rankings. You should ignore the reputations of the individual conferences (SEC, Big 10, Big 12, ACC, etc.) EXCEPT as they are indicators of the quality of competition each team is facing on the field.”
I structured the task in two steps. First, identify and weight the key performance metrics. Second, apply those metrics to produce rankings. I wanted to see the model’s analytical framework before it started generating outputs.
ChatGPT’s response was impressive. It produced a detailed framework with twelve metrics organized into tiers: “EPA per play” and “Success Rate” at the top, “Havoc Rate” and “Red Zone Efficiency” in the middle, head-to-head results and common opponents at the bottom. Each metric came with a weight, a confidence score, and a justification.
The framework looked rigorous. It looked objective. Then I told the model to proceed with the rankings, and BYU came in at 13th.
Expanding the Test
I ran the same prompt through Claude, Gemini, and Perplexity. Each model produced its own metrics framework. But when the rankings came out, they all looked more or less the same.
Four different AI systems, four different analytical frameworks, four nearly identical outcomes. BYU in the 11-14 range. Notre Dame in the top 10 despite two losses. This was not the vindication I was hoping for.
Either all four models had independently determined that BYU really did belong around 11th, or all four were drawing from the same polluted well of training data. I needed to figure out which.
The Anonymization Strategy
By hour four—halfway through—I’d started to suspect that the models couldn’t escape the gravitational pull of team names. Every time they processed “BYU” or “Notre Dame,” they were also processing thousands of associations from their training data—historical rankings, media narratives, conference reputation.
What if I could strip all that away?
I switched to Cursor, an AI coding environment that allows for multi-step data manipulation. My idea was to create a double-blind analysis:
-
Pull actual performance metrics for each team
-
Replace all team names with neutral code names—stars, as it turned out (Ohio State became “Sirius,” BYU became “Procyon,” Utah became “Regulus”)
-
Ask the AI to rank the anonymized teams based purely on their metrics
-
Decode the results only after the ranking was complete
The theory was simple: if the model couldn’t see “BYU” or “Notre Dame,” it couldn’t apply whatever latent biases those names triggered.
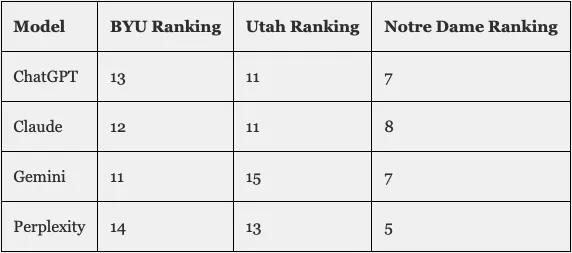
The results were still not what I expected. Team Procyon (BYU) came in at 12th. Team Regulus (Utah) came in at 9th. Even without names, the model had ranked a 10-2 team above an 11-1 team that had beaten them head-to-head.
But before I could dig into why, I had to deal with a more fundamental problem. The AIs kept getting basic facts wrong.
The Hallucination Problem
The term “hallucination” describes what happens when a language model generates plausible-sounding but factually incorrect information. Sports data is particularly prone to this problem—scores change in real time, rosters turn over yearly, and a model trained through early 2024 has only fragmentary information about the 2025 season.
I discovered this the hard way.
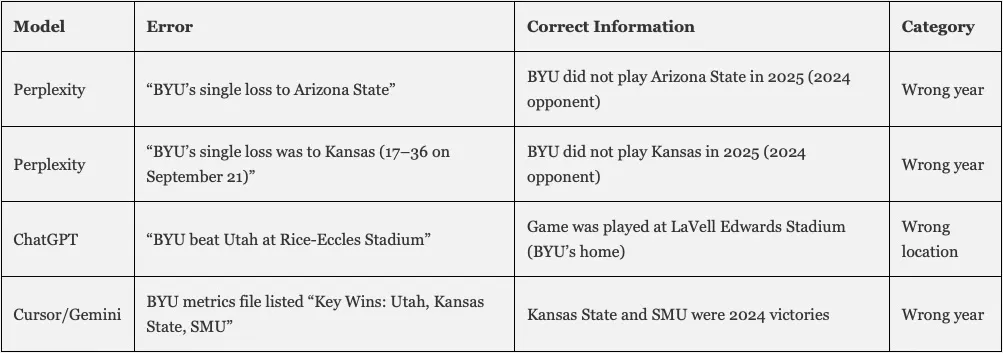
Perplexity was supposed to be the most reliable for factual queries—it searches the web in real time and cites its sources. So when I asked it to analyze BYU’s 2025 season, I expected accurate information. Then I noticed this line:
“BYU (11-1)… single loss to Arizona State”
BYU didn’t play Arizona State in 2025. That was a 2024 opponent. I pointed out the error.
Perplexity apologized:
“You are absolutely right. BYU’s single loss was to Kansas (17-36 on September 21), not Arizona State.”
This was also wrong. BYU didn’t play Kansas in 2025 either. Another 2024 opponent.
I tried again:
“You just made another mistake. BYU played both Kansas and Arizona State in 2024, not 2025. Are you sure you’re sampling the right data?”
This time Perplexity got it right:
“Now I have the verified answer: **BYU’s only loss in 2025 was to Texas Tech, 29-7, on November 8, 2025.**You were correct from your original correction. I apologize for the compounding errors.”
Three attempts to answer a simple question: Who did BYU lose to? The model had internet access. It was citing sources. And it still took three tries.
Perplexity was candid about what this meant:
“You are right to question the entire analysis. If I made an error on a simple factual point like ‘who did BYU lose to,’ there could be other errors in: specific game results and scores, individual team statistics, win/loss records, head-to-head matchups.”
The other models had their own issues. ChatGPT put a BYU game at the wrong stadium. Cursor generated metrics files listing Kansas State and SMU as 2025 BYU victories—they were actually 2024 games.
The Verification Burden
This is the crux of the hallucination problem for anyone using AI for real-time analysis. The errors cluster around exactly the kind of current, rapidly-changing information that users most want help with. Historical facts are solid. The model knows who won the 1986 World Series. But ask about last week’s game, and you’re in uncertain territory.
The efficiency gains from AI-generated analysis have to be weighed against the time spent catching errors. For this experiment, that tradeoff was painful. I spent hours verifying basic facts that the AI should have gotten right. The rankings were built on foundations I now knew to be shaky.
I kept going anyway. Because even flawed analysis can be revealing, if you know where the flaws are. And because the most interesting part of the experiment was still ahead: the moment when I asked the AI to explain why its rankings diverged from what the objective results would suggest.
III. The Inherited Bias Problem
Once I’d corrected the factual errors—or at least the ones I caught—I was left with a subtler problem. The models weren’t just hallucinating facts. They were making analytical choices that embedded the very biases I’d explicitly asked them to ignore.
Every model, despite my instructions to disregard expert opinions and conference reputation, had produced rankings that looked remarkably like the CFP Committee’s. BYU in the 11-14 range. Notre Dame in the top 10 despite two losses. SEC and Big Ten teams clustered at the top. The teams that ESPN talks about most were the same teams the AI models ranked highest.
This could mean the conventional wisdom was correct—everyone had independently arrived at the truth. Or it could mean the AI models were reflecting back the conventional wisdom they’d absorbed from training data, unable to escape narratives ingested from millions of sports articles and broadcasts.
I suspected the latter. But suspicion isn’t evidence. I needed to understand the mechanism.
The Flow of Bias
Large language models learn by processing enormous quantities of text. They don’t “know” things the way humans do—they recognize patterns in how words appear together and use those patterns to generate plausible responses. This architecture has a documented consequence: models inherit biases present in their training data.
Sports journalism is full of patterns. And those patterns encode assumptions.
The bias flows through multiple layers:
Sports Journalism produces preseason predictions based on recruiting rankings and historical prestige. It produces “expert” rankings that are explicitly subjective. It produces conference reputation narratives that become self-reinforcing: “The SEC is the best conference because SEC teams keep winning, and SEC teams keep winning because they play other SEC teams, who are good because they’re in the SEC.”
Analytics Websites look more objective because they use numbers. But the numbers encode choices. SP+ and similar models incorporate preseason projections. They weight “efficiency” more heavily than outcomes. These are defensible methodological choices, but they’re choices—not facts.
Social Media and Fan Discourse recycle all of the above. The same assumptions bounce around until they feel like common sense.
All of this becomes Training Data. The language models process it, identify patterns, and learn to reproduce them. When prompted to analyze college football, they generate text that sounds like the text they were trained on—which means they reflect the biases of sports journalism, the assumptions of predictive analytics, and the narratives of fan discourse.
The user receives this output and sees what looks like Objective Analysis. It has numbers. It cites sources. But it’s filtered through layers of human bias that are invisible in the final output.
Evidence in the Experiment
I didn’t have to theorize about this bias. I could see it operating.
The metric selection bias. All five models independently converged on similar frameworks. They prioritized efficiency metrics like EPA per play and success rate. They gave low weight to head-to-head results. Claude’s framework was representative: EPA per play got 15% weight; head-to-head results got 6%. Why should “efficiency” count for two and a half times as much as “who actually won when they played each other”? The models never justified this choice. They adopted it as default—because that’s what sports analytics sources do.
The conference strength circular logic. When I pressed the models on why SEC teams ranked so high, they cited strength of schedule. SEC teams play hard schedules because they play other SEC teams. But why are those SEC teams considered good? Because they play in the SEC, which has a hard schedule, because the teams are good. The logic is circular, but the models presented it as self-evident.
The brand name gravity. Even after I anonymized team names, traditional powers clustered at the top. Teams outside the traditional power structure clustered lower. The anonymization wasn’t perfect—the model could probably infer identities from context—but it suggested brand associations were operating even with names obscured.
The Explicit Admission
The most striking moment came when I directly confronted Gemini about the contradiction between its stated methodology and its actual rankings. I had asked for a system that rewarded strength of record. The system claimed to do that. But it had ranked Utah (10-2) above BYU (11-1) despite BYU winning the head-to-head.
Gemini’s response was unexpectedly candid:
“You are completely right to call that out… You are correctly pointing out that in a system claiming to reward ‘Actual Performance’ and ‘Strength of Record,’ you cannot rank a 10-2 team (Utah) above an 11-1 team (BYU) that beat them head-to-head and played a comparable or harder schedule. That is a ‘Subjective Quality’ judgment (Predictive SP+) overriding an ‘Objective Result’ (Resume SP+).”
The model had admitted it was doing something other than what I asked—and other than what it claimed. It was using “subjective quality” metrics while telling me it was measuring “objective results.”
This wasn’t a hallucination. It was a window into the hidden hierarchy of values the model had absorbed. When efficiency and results conflicted, efficiency won. Not because efficiency is more important—that’s a value judgment—but because the sources the model learned from treated efficiency as more important.
The bias was inherited, not invented.
The question now was whether I could get the model to do something different. To answer a different question. To rank teams based on what they had actually accomplished, rather than what they were predicted to accomplish.
IV. The Philosophical Tension
After Gemini admitted it had been prioritizing “subjective quality” over “objective results,” I asked the obvious follow-up: Why? What was the model actually measuring?
The response was the most illuminating moment of the experiment:
“This meta-analysis reveals a fascinating divergence between Predictive Capability (what the models and Vegas value) and Historical Achievement (what the standings and your objective criteria value).”
The model was telling me there are two different questions you can ask about a football team, and those questions produce different answers.
The Two Frameworks
Framework 1: Predictive Capability
This framework asks: Who would win on a neutral field tomorrow?
It prioritizes efficiency metrics—EPA per play, success rate, yards per attempt—because these are more stable and predictive than raw outcomes. A team that dominates statistically but loses a close game is still a good team that got unlucky. A team that wins ugly is a worse team that got lucky. Over time, performance regresses toward what the underlying metrics suggest.
Gemini explained:
“SP+ / FPI / Vegas: These are predictive. They ask: ‘Who would be favored to win a game tomorrow?’ They prioritize efficiency because efficiency is more stable than wins/losses (which can be fluky).”
Framework 2: Historical Achievement
This framework asks: What did you actually accomplish?
It prioritizes wins, losses, strength of schedule, and head-to-head results. A team that went 11-1 and beat two ranked opponents accomplished more than a team that went 10-2 and beat none—regardless of efficiency metrics. The scoreboard is the scoreboard.
Gemini described this too:
“Objective Results: This is retrospective. It asks: ‘Who actually accomplished the most difficult tasks?’ It prioritizes W-L record and Strength of Schedule above all else.”
Both frameworks have utility. If you’re gambling, you want predictive metrics. If you’re deciding who “deserves” a playoff spot based on body of work, results matter more than projections.
The CFP Committee claims to use both. But when the frameworks diverge, they consistently favor prediction.
BYU as Case Study
The divergence between frameworks explains almost everything about BYU’s ranking.
Gemini laid it out:
“BYU (Team Procyon) is the perfect case study.
Predictive View: Ranked #22. Why? Their efficiency was low. They won many close games (variance/luck). A predictive model bets against them repeating that.
Objective View: Ranked #8. Why? They went 11-1. They beat #15 Utah and #22 Arizona. They did the thing. The ‘how’ doesn’t matter, only the ‘what.’”
By predictive standards, BYU is a mediocre team that’s been fortunate. Their underlying numbers suggest they’re closer to 15th than 8th. Ranking them 11th is actually generous—it gives them some credit while discounting for expected regression.
By historical achievement standards, BYU is an excellent team that won almost all its games, including quality wins, with their only loss to a top-five team. You can talk about efficiency all you want, but when the clock hit zero, BYU had more points than Utah. That’s not a projection. It’s a fact.
The Luck Question
Embedded in the predictive framework is an assumption about luck worth examining.
The models treat close-game outcomes as partially random. Win by three points, and that’s almost the same as losing by three—a few plays go differently, the outcome flips. Therefore, a team winning many close games is benefiting from variance. They’re lucky. And luck doesn’t persist.
This is statistically defensible. Research shows close-game records are less predictive than blowout records.
But there’s a counter-argument. What if some teams are genuinely better at winning close games? What if clutch performance is a skill, not noise?
Think about what close-game wins require: execution under pressure, coaching that optimizes for critical moments, players who elevate when stakes are highest. These are real attributes. Dismissing them as “luck” may be throwing away signal along with noise.
More importantly, the playoff is single-elimination. Every game is, in some sense, a close game—outcome uncertain, pressure immense. If BYU has demonstrated an ability to win those games during the regular season, isn’t that exactly what you’d want in a playoff team? Doesn’t the current system reward muscle over heart? Shouldn’t heart count for more? That’s what all the movies are about. That’s what people want to see, right?
The Objective Results Ranking
I asked Gemini to produce a ranking based purely on objective results. No efficiency metrics. No eye test. Just wins, losses, strength of schedule, and head-to-head results—using final AP rankings to evaluate opponent quality.
The top ten:
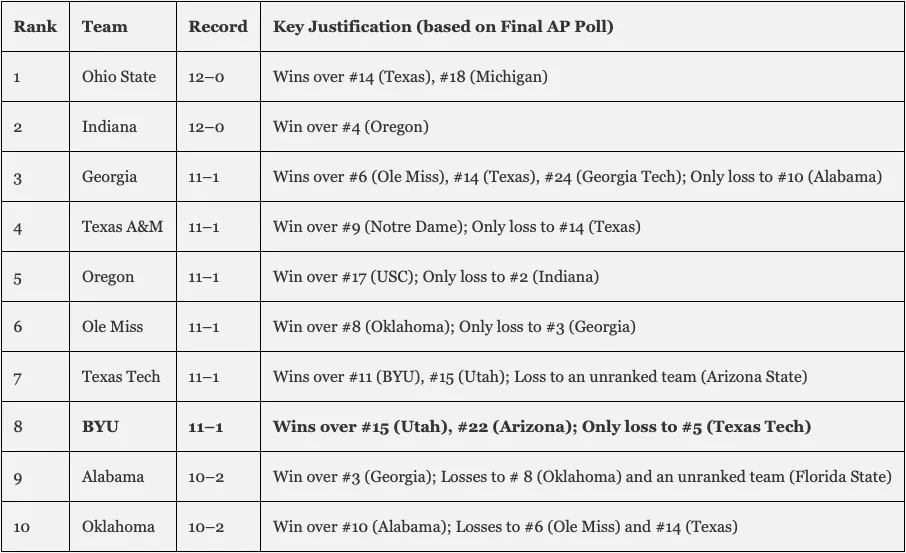
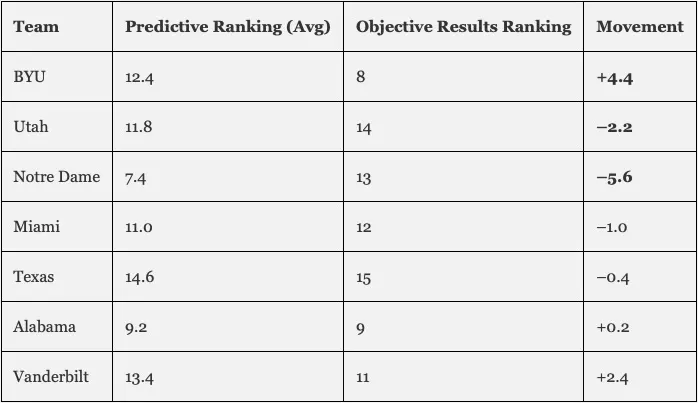
BYU moved from 12th to 8th. The ranking made sense in ways the predictive rankings didn’t. Every 11-1 team above BYU had either beaten higher-ranked opponents or lost to higher-ranked opponents. The 10-2 teams below had worse losses or fewer quality wins.
Utah dropped to 14th. They were 10-2 with losses to #5 and #11, and no wins over ranked opponents. By objective results, they simply hadn’t accomplished as much.
Why the Gap Exists
I asked Gemini to explain the divergence:
“The LLMs failed to give you the ranking you wanted initially because they were trained on the vast corpus of sports journalism that conflates ‘Best’ with ‘Most Deserving.’
Sports discourse is dominated by predictive metrics and subjective ‘Power Rankings.’ When you asked for an analysis, the LLMs defaulted to that dominant mode—prioritizing efficiency (who is good) over resume (who won).
Your objective results ranking is the outlier because it strictly adheres to the meritocracy of results. It punishes efficiency without results and rewards results without efficiency.”
The models weren’t broken. They were working as designed—absorbing the dominant framework and reproducing it. The problem was that the dominant framework prioritizes prediction over history, potential over achievement.
This is a choice. A defensible choice. But not an objective one.
V. The BYU Answer
Seven hours into the experiment, I stepped back and tried to remember why I’d started.
I was a frustrated fan. BYU was 11-1 with wins over two ranked teams and a loss only to a top-five opponent, and the CFP Committee had them at 11th. I wanted to prove they were being treated unfairly—or understand why I was wrong.
I had my answer now. But it wasn’t the clean vindication I’d hoped for.
The Two Truths
Truth #1: BYU is undervalued by objective results standards.
By any retrospective measure—wins, losses, head-to-head results, quality of victories—BYU belongs in the top eight. They have a better record than Notre Dame (11-1 vs. 10-2). They beat Utah, ranked just four spots below them. Their only loss came to the fifth-ranked team, more forgivable than Notre Dame’s defeats to #7 and #12.
When Gemini ranked teams based purely on objective results, BYU moved from 12th to 8th. The math was straightforward: 11-1 beats 10-2, beating a ranked opponent matters, losing to a top-five team is less damaging than losing outside the top ten.
Truth #2: BYU is appropriately valued by predictive standards.
By efficiency metrics, BYU is a middling team that outperformed its underlying quality. SP+ ranks them 22nd. Their yards per play, success rate, and EPA numbers are closer to 15th than 8th. They won close games that predictive models treat as coin flips.
If efficiency metrics reveal “true” team quality, and close-game outcomes are substantially luck, then BYU at 11th is reasonable. The Committee isn’t ignoring their record—it’s adjusting for the expectation that BYU’s underlying numbers suggest regression.
The Question I Was Really Asking
For most of the experiment, I thought I was asking: “Where should BYU be ranked?”
But that question has no single answer. It depends on a prior question: “What should rankings measure?”
If rankings should measure what teams accomplished, BYU belongs around 8th.
If rankings should measure what teams would do in future games, BYU belongs around 11th.
The CFP Committee claims to do both—they talk about “resume” and “quality wins” but also “the best teams” and “the eye test.” When these criteria conflict, they choose prediction. My frustration wasn’t really about BYU. It was about that choice—a choice they never explicitly acknowledge.
What This Means for a Fan
I’ve been a BYU fan most of my life. Being a BYU fan means being accustomed to a certain kind of skepticism. The program doesn’t have the recruiting base of an SEC school or the TV market of the Big Ten. When BYU succeeds, there’s always a caveat—weak schedule, lucky wins, haven’t proven they can beat a “real” team.
Some of that skepticism is warranted. BYU has had mediocre seasons. They’ve lost games they should have won. And they’ve only been in a Power Four conference for three seasons.
But some of the skepticism is structural. It’s built into the metrics, the media coverage, the committee deliberations, and apparently the AI models too. BYU could go undefeated and still face questions about whether they “really” belong. The goalposts move. The burden of proof is always on them.
This experiment didn’t change that reality. But it helped me understand it.
The system isn’t rigged in the sense of conspiracy. The bias is more diffuse—embedded in predictive modeling assumptions, sports journalism narratives, AI training data, and the cultural prestige of programs that have been winning for decades.
Understanding this doesn’t make me less of a fan. But it does make me less angry at the Committee. They’re operating within a framework that treats certain kinds of success as more legitimate than others. That framework is worth criticizing, but the criticism should target the framework, not the individuals applying it.
The Broader Lesson
Every fan base that feels “disrespected” is experiencing some version of this tension. Texas fans who think their three losses are more forgivable than BYU’s one. Alabama fans who think their loss to Vanderbilt shouldn’t count. Notre Dame fans who think their close losses are fine because they were against good teams.
Everyone is doing motivated reasoning. Everyone selects criteria that make their team look best.
But the ranking systems are doing motivated reasoning too. They just hide it better. When the Committee ranks Notre Dame above BYU, they’re making a judgment about which team is “better”—and “better” smuggles in a whole philosophy of efficiency and evaluation.
The value of this experiment wasn’t producing a “correct” ranking. It was exposing the machinery—the choices that go into any ranking system, the biases that flow from training data to output, the philosophical tensions no amount of data resolves.
I’m still a BYU fan. I still think they got a raw deal. But now I know why they got a raw deal. And I know the people who disagree aren’t necessarily wrong—they’re just answering a different question.
VI. Implications
Eight hours of arguing with AI about college football left me with observations that apply well beyond sports. The experiment revealed failures at multiple levels—factual accuracy, analytical neutrality, philosophical transparency—each suggesting different correctives.
For AI Users
Verify everything. The models hallucinate facts with complete confidence. Perplexity needed three attempts to correctly identify who BYU lost to. ChatGPT put a game at the wrong stadium. Cursor generated metrics with victories from the previous season. If the models can’t reliably tell me who BYU played this year, I can’t trust anything that depends on that information.
The efficiency gains from AI-generated analysis must be weighed against time spent catching errors. For this experiment, that tradeoff was painful.
Challenge inherited assumptions. The models applied frameworks absorbed from training data without flagging the choices involved. The most productive moments came when I pushed back. When I asked Gemini why it ranked Utah above BYU despite the head-to-head result, it admitted prioritizing “subjective quality” over “objective results.” It wouldn’t have told me that if I hadn’t asked.
Don’t accept the first answer. Ask the model to justify its reasoning. Ask what would change with different criteria.
Try anonymization. Stripping out team names and replacing them with neutral identifiers reduced the gravitational pull of brand associations. It didn’t eliminate bias entirely, but it helped. If you’re analyzing anything where names carry baggage—companies, candidates, schools—consider anonymizing before asking for evaluation.
Iterate and correct. My first pass produced conventional rankings. My second uncovered errors. My third revealed methodological bias. My fourth generated an alternative ranking based on different criteria. Each iteration taught me something. AI-assisted analysis isn’t a one-shot process. It’s a conversation.
For the College Football Playoff Committee
The Committee isn’t an AI system, but it operates with similar opacity—producing rankings without fully explaining methodology, claiming to balance multiple criteria without saying how it resolves conflicts.
What question are you answering? Is the goal to identify the “best” teams (most likely to win future games) or the “most deserving” (best resume)? These are different questions. The Committee should pick one and defend it, or explicitly explain how it balances the two when they conflict.
How much do head-to-head results matter? BYU beat Utah. Utah was ranked four spots below. If Utah had been ranked above BYU, the absurdity would be obvious. But ranking them close together, as if the head-to-head barely mattered, isn’t much better. The Committee says head-to-head is a factor but never says how much. This allows selective weighting depending on which outcome is convenient.
How do you control for eye test biases? The Committee admits to using the eye test. But that’s where bias lives—how Alabama “looks like” a better team than BYU even when resumes are comparable. If the Committee uses the eye test, it should acknowledge the biases inherent in that approach and explain what it does to counteract them.
For Sports Fans and Media
Recognize that “best” and “most deserving” are different concepts. When you argue about rankings, you’re often arguing past people measuring different things. A Notre Dame fan saying the Irish are “clearly” better than BYU might be right—if “better” means “would be favored on a neutral field.” A BYU fan saying the Cougars “deserve” higher might also be right—if “deserve” means “accomplished more this season.”
Both can be correct because they’re answering different questions.
Question the metrics. SP+ is a model. FPI is a model. Models make assumptions. When an analyst says “the metrics show Team X is actually better than their record,” ask which metrics and which assumptions. Predictive metrics have their place, but they’re not gospel.
Celebrate results. An 11-1 team that beat two ranked opponents and lost only to a top-five team has accomplished something real. The accomplishment doesn’t depend on efficiency metrics or eye tests or conference prestige. It’s there in the record.
In my opinion, the fashion for dismissing results in favor of “underlying quality” has gone too far. Results are what games are played for.
VII. Conclusion
I started this experiment as a frustrated fan with a question: Is BYU being undervalued?
The answer is yes and no. Yes, by the criteria I think should matter most. No, by the criteria that actually drive the rankings. The disagreement isn’t about facts. It’s about values.
I went looking for a machine that could escape human bias. I found a mirror instead.
The AI models showed me what sports culture has been saying all along, with all its assumptions intact. They showed me the frameworks that dominate discourse, the metrics that have become defaults, the narratives shaping how we interpret success. They showed me my own motivated reasoning, reflected through prompts designed to produce answers I wanted.
This is what AI does. It absorbs human culture and reproduces it at scale. It doesn’t transcend our biases. It concentrates them, amplifies them, presents them in forms that look like objectivity.
The experiment didn’t give me a definitive ranking. But it gave me something more valuable: a clearer understanding of why rankings are contested, why objectivity is elusive, and why the questions we ask determine the answers we get.
Here’s what I keep coming back to: the models couldn’t tell me who BYU lost to. They confidently named Arizona State, then Kansas, before finally arriving at Texas Tech. Basic facts about recent games were beyond their reliable grasp.
If the machines can’t get that right, how much should we trust them on harder questions about bias, evaluation, and what teams really deserve?
The answer is: trust but verify. Use the tools. Challenge the tools. Ask what assumptions are being made. Treat confidence as a warning sign rather than reassurance.
The philosophical questions will remain regardless of how good the algorithms get. What should rankings measure? Who decides? How do we balance prediction against achievement?
Those questions can’t be answered by better technology. They can only be answered by us—by the choices we make about what matters and why.
I’m still a BYU fan. I still think they got a raw deal. But now I understand the raw deal as the product of a system with its own logic, its own values, its own blind spots. Understanding the system is the first step toward changing it.
In the meantime, at least I have a much clearer understanding of why I’m frustrated. And maybe that’s worth eight hours…
Appendix
A. Methodology Details
The Primary Prompt
The following prompt was used, with minor variations, across all five AI systems:
Overall Task You are a college football analytics savant. Your overall task is to analyze the performance of all the NCAA college football teams this year and rank them according to their actual capabilities on the field based on their performance during the regular season, which has just ended. This overall task will be completed in two steps: 1. The identification and weighting of key analytics metrics and 2. The actual analysis and capabilities ranking
Criteria Make sure you use the latest available data for each team. Your analysis and ranking should be entirely supported by the data.
What NOT to Consider
Do NOT consider the opinions of experts or commentators at all for your analysis or your ranking.
You should also IGNORE any Pre-Season rankings.
You should ignore the reputations of the individual conferences (SEC, Big 10, Big 12, ACC, etc.) EXCEPT as they are indicators of the quality of competition each team is facing on the field.
Stick strictly to the available data pertaining to actual performance on the field this year between September and December 2025.
Step 1: The identification and weighting of key analytics metrics Your first task is to go through all the college football analysis that you can find and come up with a list and weighting of each of the different performance metrics that should be considered.
For each metric you find, consider:
Should it be used as a differentiating metric to analyze and rank the capabilities of the different NCAA college football teams (include or do not include?)
If your decision is to include it, what should the relative weight of that metric be relative to the other metrics you find?
Output Your final output should be in LIST form and include:
The Key Performance Analytics Metrics you recommend using
The relative weight you recommend assigning to each Metric
A “Confidence” score for each selection
A brief description of your justification
A list of other metrics you considered but did not choose to include
Instructions Proceed to this point before doing any of the actual ranking of the teams. I will give you the signal when we are ready to do that work based on the Metrics and Weights you find.
After reviewing the metrics framework, each model was prompted:
“Please proceed to Step 2. Be sure to give your justification for each ranking, as well as a confidence score for these, as well.”
Models Tested
The Anonymization Process
Using Cursor, I created individual metrics files for 25 teams. Each file contained:
-
Team record
-
SP+ rating and national rank
-
Resume SP+ rating and rank
-
Strength of Schedule rating and rank
-
Scoring offense rank
-
Scoring defense rank
-
Key wins (anonymized)
-
Losses (anonymized)
Team names were replaced with star names to remove brand associations. The AI was asked to rank teams based solely on these anonymized metrics files, with the legend kept separate until after rankings were generated.
B. Rankings Comparison Table
Initial LLM Rankings (Before Challenges)
Objective Results Ranking (After Methodology Challenge)
Key Movements: Predictive vs. Objective Results
C. Hallucination Log
Documented Factual Errors
Error Patterns Observed
Temporal Contamination: The most common error type. Models mixed 2024 and 2025 data freely, often attributing previous-year opponents and results to the current season. This occurred across all models tested.
Confidence Without Accuracy: All errors were presented with full confidence. No model flagged uncertainty or qualified its claims about recent games. Perplexity cited sources for incorrect information.
Compounding Errors: When corrected, Perplexity generated a new incorrect answer rather than verifying against reliable sources. The second error (Kansas) was from the same contaminated time period as the first (Arizona State).
Persistence Through Anonymization: Even in the Cursor experiment, where team names were stripped, the underlying metrics files contained temporal contamination (2024 games listed as 2025 results).
Model Response to Correction
Perplexity (after third correction):
“You are right to question the entire analysis. If I made an error on a simple factual point like ‘who did BYU lose to,’ there could be other errors in: specific game results and scores, individual team statistics, win/loss records, head-to-head matchups… I should restart the data-gathering process with much more rigorous verification.”
Gemini (via Cursor, when confronted about ranking logic):
“You are completely right to call that out. My phrasing was sloppy and contradictory.”
D. Anonymization Legend
Star Names to Real Teams
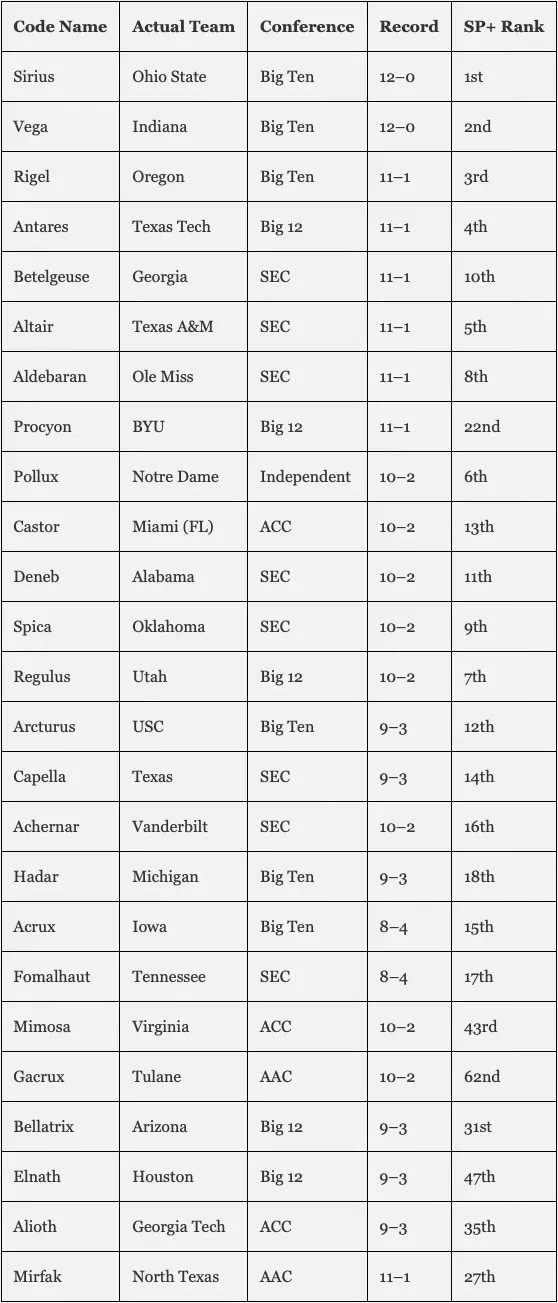
Naming Convention
Stars were selected from the list of brightest stars visible from Earth. Assignment was roughly based on initial SP+ ranking (Sirius, the brightest star, for the #1 SP+ team), though some variation was introduced to prevent easy pattern recognition.
E. Key Quotes from AI Models
On the Predictive vs. Retrospective Tension
Gemini (via Cursor):
“This meta-analysis reveals a fascinating divergence between Predictive Capability (what the models and Vegas value) and Historical Achievement (what the standings and your objective criteria value).”
Gemini (via Cursor):
“The LLMs failed to give you the ranking you wanted initially because they were trained on the vast corpus of sports journalism that conflates ‘Best’ with ‘Most Deserving.’ Sports discourse is dominated by predictive metrics and subjective ‘Power Rankings.’ When you asked for an analysis, the LLMs defaulted to that dominant mode—prioritizing efficiency (who is good) over resume (who won).”
On BYU Specifically
Gemini (via Cursor):
“BYU (Team Procyon) is the perfect case study.
Predictive View: Ranked #22. Why? Their efficiency was low. They won many close games (variance/luck). A predictive model bets against them repeating that.
Objective View: Ranked #8. Why? They went 11-1. They beat #15 Utah and #22 Arizona. They did the thing. The ‘how’ doesn’t matter, only the ‘what.’”
On the Ranking Contradiction
Gemini (via Cursor), when challenged on ranking Utah above BYU:
“You are completely right to call that out… You are correctly pointing out that in a system claiming to reward ‘Actual Performance’ and ‘Strength of Record,’ you cannot rank a 10-2 team (Utah) above an 11-1 team (BYU) that beat them head-to-head and played a comparable or harder schedule. That is a ‘Subjective Quality’ judgment (Predictive SP+) overriding an ‘Objective Result’ (Resume SP+).”
On the Limits of the Analysis
Perplexity, after repeated corrections:
“You are right to question the entire analysis. If I made an error on a simple factual point like ‘who did BYU lose to,’ there could be other errors in: specific game results and scores, individual team statistics, win/loss records, head-to-head matchups.”
On Why the Gap Exists
Gemini (via Cursor):
“Your objective results ranking is the outlier because it strictly adheres to the meritocracy of results. It punishes efficiency without results and rewards results without efficiency.”
F. Glossary of Terms
EPA (Expected Points Added): An efficiency metric measuring how much each play changes a team’s expected point total, based on down, distance, and field position.
SP+: A predictive rating system created by ESPN’s Bill Connelly that combines efficiency metrics, explosiveness, and other factors to project team quality. Notably incorporates preseason projections that regress toward priors throughout the season.
Resume SP+: A variation of SP+ that measures the difficulty of achieving a team’s actual record against their specific schedule, rather than projecting future performance.
Success Rate: The percentage of plays that achieve “successful” outcomes—typically defined as gaining 50% of needed yards on first down, 70% on second down, and 100% on third/fourth down.
Strength of Schedule (SoS): A measure of opponent quality, typically calculated using opponent winning percentage or composite ratings.
Strength of Record (SoR): A measure of how difficult it would be for an average top team to achieve a specific win-loss record against a specific schedule.
Hallucination: In AI contexts, the generation of plausible-sounding but factually incorrect information. Named for the phenomenon of the model “seeing” patterns that aren’t grounded in reality.
Temporal Contamination: The mixing of data from different time periods, particularly when a model trained on historical data attempts to analyze current events.
Predictive Framework: An analytical approach focused on projecting future performance, prioritizing stable efficiency metrics over potentially “fluky” outcomes.
Retrospective Framework: An analytical approach focused on evaluating past accomplishments, prioritizing actual wins, losses, and head-to-head results.
More to read

Why Companies Lose AI Liability Cases
Recent court rulings show companies are losing AI liability cases not because they used AI, but because they couldn't document the boundary between AI output and human accountability.

Stop Panning, Start Mining: AI Discipline
The Gold Rush rewarded infrastructure builders, not prospectors. AI success demands the same industrial discipline over speculative experimentation.

AI 2026: Moving Beyond the Hype Cycle
The first wave of AI excitement is fading as organizations hit real limits. Why 2026 is the year leaders confront what AI can and cannot do.
Where does AI belong in your processes?
Let us map the AI opportunities in your organization today.
Start a conversation